A monitoring dashboard with no alerts is a museum. A dashboard that alerts on everything is a white-noise machine. Both fail the same way: the moment something real happens, nobody notices, because everybody has already trained themselves to ignore the tool that cries wolf. Setting alert thresholds is where monitoring actually earns its place.
Why thresholds beat raw numbers
A raw number such as “CPU is at 70%” tells you nothing. 70% could be a busy-but-healthy database during the lunch crowd, or a daemon spiraling out of control on a box that normally idles at 5%. The threshold is what turns the number into a decision: above this line, a human should look. That line has to be drawn from the machine’s own behavior, not from a generic template.
The starting point for every threshold is a baseline. Run a host for a week without thresholds and watch what normal looks like. Peak CPU during the day, idle at night, disk growth per day, memory after a long uptime. Only against that picture does a number become suspicious.
Baselines are not glamorous, and they are the reason alert configs fail. Almost every noisy alert rule traces back to a person who wrote a “reasonable” number without measuring the host first. A host that spikes to 90% CPU every morning during its report job will page you daily until you learn that the spike is the job. Measure first, then draw the line.
CPU thresholds that catch real problems
A flat CPU alert at 90% is the classic noise generator, because many healthy workloads spike that high for seconds and fall again. Better signals are duration and persistence, not the spike itself.
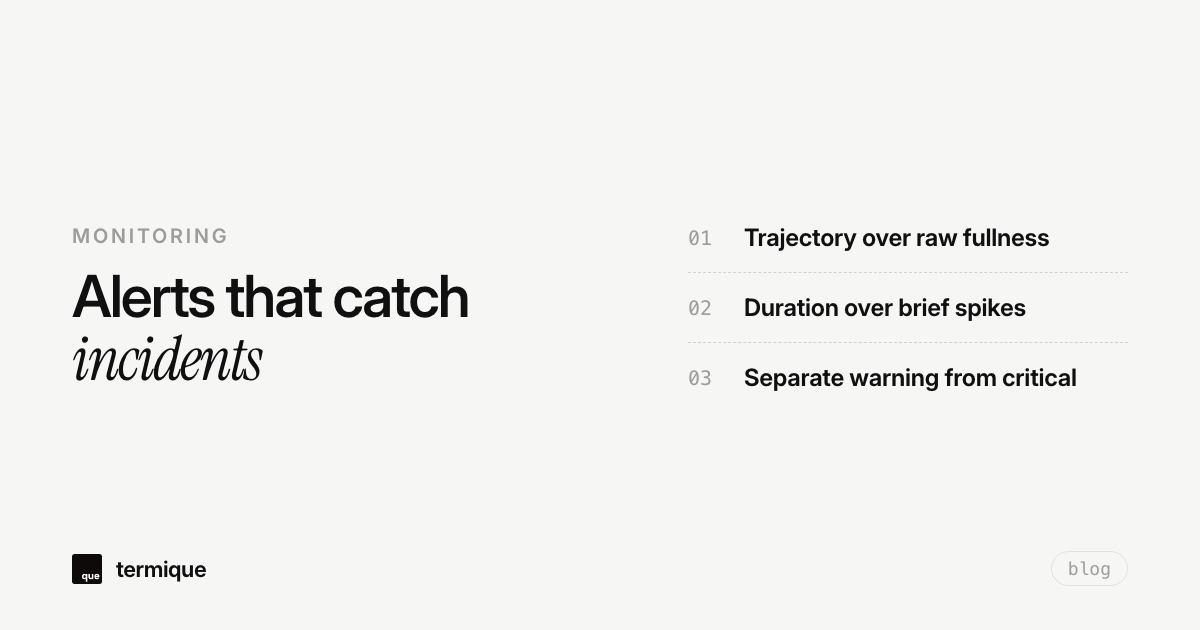
- Alert on sustained load, not instantaneous spikes. One minute above 90% is often a transitory burst. Ten minutes is a story.
- Watch load average relative to core count. Load above core count for a sustained window means work is queuing.
- Correlate CPU with the metric that actually broke, response time or queue depth, so the alert means something to a human.
- Watch for load that climbs through the day even at “low” percentages. A gradual ramp is the signature of a slow leak, not a burst.
The practical rule of thumb: a single data point should never page anyone. Require N consecutive readings above the line, or a reading sustained for M minutes, before the alert fires. That one setting removes the majority of false positives from CPU alerting.
Memory thresholds that do not fire at 3 AM
Memory is where most alert configurations go wrong, because Linux borrows memory aggressively for cache and looks “almost full” all the time. Alerting on raw used memory counts cache as used, and every long-running box ends up paging constantly.
The threshold that matters is sustained pressure plus a swap trend: swap usage growing across a day, or available memory near zero while swap keeps climbing. The no-toolbox CPU, RAM, disk monitoring guide walks through reading those figures by hand, which teaches what the alert should watch.
In practice, the single most useful memory metric for alerting is available memory from /proc/meminfo (MemAvailable), which already excludes reclaimable cache the kernel could give back in a pinch. Alert when MemAvailable stays low while swap usage grows, because that combination means the machine is genuinely under pressure, not just caching files.
Disk thresholds: alert on trajectory, not fullness
A disk at 85% is either a problem in four days (hard drives fill faster than you think) or a stable long-term state, depending on your workload. The useful alert is the trend: how many days until the disk reaches capacity at the current fill rate. That makes the threshold a head start instead of a funeral notification.
The practical version: warn at the level where you have enough lead time to act, which for most workloads is 75-85%, and page at 90-95%. The exact numbers are less important than having both a warning and a critical tier. Disk usage monitoring best practices cover the rest of the method.
The trajectory calculation is simple: sample the used bytes once a day, keep a week of samples, and fit a line. Days-to-full = (capacity – used) / daily growth. A disk growing 2% per day is far more urgent than one at 90% that has been flat for a month. Trajectory beats fullness in every honest comparison of which alert saved the incident.
Uptime and reachability alerts
Reachability alerts need the same tiering. A single failed probe can be a blip; three consecutive failures across a minute is an incident. Every uptime alert should use a retry count or a failure window, otherwise you wake up to a false alarm for a network hiccup that resolved itself in nine seconds.
There is a full pattern for uptime alerts without a third-party bill if you want the self-hosted path, including the probe cadence that keeps false positives low.
Alert fatigue is a design bug, not a discipline problem
When a team ignores alerts, the first impulse is to blame the team. The second, and usually correct, impulse is to audit the alert rules. Every alert that fired and required no action is a rule to tune or delete. Every alert that required an action nobody took is a rule to raise visibility on. That loop, applied after each incident, is what makes a monitoring setup age well.
Run the audit on a schedule, not just after incidents. A quarterly pass over the alert rules, deleting anything that has not fired meaningfully, mirrors the discipline of an SSH access review: both are about removing accumulated noise that hides the signal.
The other half of fatigue is routing. An alert that pages everyone equally produces the same “someone else will look” behavior as an ignored tool. Route warnings to a channel that can wait, and route criticals to the on-call rotation, so the critical tier keeps its emotional weight.
How infrastructure context changes the thresholds
Thresholds are per-machine decisions. A database box needs tighter memory pressure rules than a static file server, and a load balancer’s connection count matters more than its CPU. If you are monitoring a fleet where machines have different roles, group them and give each group its own threshold set. The role-based view is also the one that most easily connects to the full Linux server monitoring stack.
How infrastructure context changes the thresholds
Thresholds are per-machine decisions. A database box needs tighter memory pressure rules than a static file server, and a load balancer’s connection count matters more than its CPU. If you are monitoring a fleet where machines have different roles, group them and give each group its own threshold set. The role-based view is also the one that most easily connects to the full Linux server monitoring stack.
Setting up alert escalation: warning vs critical runbooks
A threshold without an associated runbook is an invitation to panic. Every alert rule should clearly specify whether it is an informational warning or an actionable critical incident, along with the first triage command:
# Warning: CPU > 80% for 15 mins
# Runbook: check top runaway processes and thread counts
ps aux --sort=-%cpu | head -n 10

# Critical: Disk used > 90%
# Runbook: find top 5 largest directories and log culprits
sudo du -h --max-depth=2 /var | sort -hr | head -n 10
sudo journalctl --vacuum-time=2d

# Warning: MemAvailable < 15% and swap increasing
# Runbook: identify memory-leaking workers
ps aux --sort=-%mem | head -n 10
Documenting these triage snippets directly in the alert message saves valuable minutes during on-call response. When an on-call engineer receives an alert with the diagnosis command pre-written, triage time drops from ten minutes to thirty seconds.
Anomaly detection vs static thresholds
While static thresholds (such as CPU > 85%) are easy to understand, they struggle with cyclic workloads like batch processing or diurnal traffic spikes. Modern telemetry systems supplement static rules with moving-window anomaly detection (such as standard deviation above a 7-day rolling average).
For batch servers, pair static ceilings with rate-of-change alerts. An unexpected 40% jump in memory consumption over 5 minutes is frequently a far clearer indicator of a memory leak than crossing an arbitrary 80% mark that the server naturally hits every afternoon under peak user traffic.
The takeaway
- Thresholds are per-host decisions built from baselines, not template defaults.
- Alert on duration and trajectory for CPU, swap growth for memory, fill rate for disk.
- Tier every alert: warn catches it early, critical only when a human must act now.
- After each on-call rotation, tune the rules that cried wolf.
The goal is a monitoring setup where an alert means something. If you want the whole picture of where monitoring fits in a server fleet, the Linux server monitoring guide ties the layers together.
Thresholds are per-server work, which is exactly why an SSH manager is the natural home for them. termique is a free SSH manager we build, and it includes server monitoring with custom thresholds for CPU, RAM, disk, and uptime. termique.app, if you are curious.